Debugging with Swift Combine Framework
The functional reactive features of the Swift Combine framework, that contribute to the control flow of your program, are deeply nested inside the framework implementation and often result in non-sequential execution of our code. Therefore, the traditional debugging practices, like setting breakpoints manually and examining stack traces, are often of no help when tracing Combine code. In this article, we’ll study different ways of debugging functional reactive code written with the Swift Combine framework.
If you want familiarize yourself with the core concepts of Combine, here is a good place to start: Getting Started with Combine framework.
Reading the Console
The simplest yet powerful technique is printing stream events to the Xcode console and then tracing the logs. Combine offers two ways of doing this: handleEvents() and print(). Both are non-intrusive and do not introduce any side effects to the stream.
Given a publisher that transforms numbers into squares, let’s examine how we can trace its execution:
let squares = [1, 2, 3].publisher
    .map { $0 * $0 }
    .sink { _ in }
Let’s add the print() operator to the stream:
let squares = [1, 2, 3].publisher
    .print("Squares")
    .map { $0 * $0 }
    .sink { _ in }
It will print:
Squares: receive subscription: ([1, 2, 3])
Squares: request unlimited
Squares: receive value: (1)
Squares: receive value: (2)
Squares: receive value: (3)
Squares: receive finished
The print() operator logs all elements passed by the immediately previous publisher together with significant subscription events. It accepts two parameters: a prefix and an output.
The prefix allows to keep track of the overwhelming log messages. Make sure to pass one when tracing several streams. Otherwise, things will get out control quickly.
The second parameter is an instance of TextOutputStream. You can provide a custom implementation to transform or redirect the log messages., e.g. add a timestamp or write to a file. It defaults to the standard output.
The print() method often logs too much and gives you no control over such a behavior. The handleEvents() operator is selective to what you are logging. It allows to intercept any significant event in publisher-subscriber life cycle:
let squares = [1, 2, 3].publisher
    .handleEvents(receiveSubscription: { print("Receive subscription: \($0)") },
                  receiveOutput: { print("Receive output: \($0)") },
                  receiveCompletion: { print("Receive completion: \($0)") },
                  receiveCancel: { print("Receive cancel") },
                  receiveRequest: { print("Receive request: \($0)") })
    .map { $0 * $0 }
    .sink { _ in }
It will print:
Receive request: unlimited
Receive subscription: [1, 2, 3]
Receive output: 1
Receive output: 2
Receive output: 3
Receive completion: finished
Although the output looks almost identical to the print() method, handleEvents() provides extra debugging opportunities to:
- skip events we are not interested in;
- set breakpoints manually;
- act on events.
Generating Xcode Debugger Breakpoints
If you’ve already placed logs all over your code and still struggling to catch the bugs, it’s time to resort to debugger. The Swift Combine framework provides two methods for this purpose:
breakpointOnError()triggers the debugger if any of the upstream publishers sent an error event.breakpoint()allows to intercept significant subscription events and optionally stop the process in the debugger.
let squares = [1, 2, 3].publisher
    // return true to stop the process in the debugger
    .breakpoint(receiveSubscription: { subscription in
        return false
    }, receiveOutput: { value in
        return false
    }, receiveCompletion: { completion in
        return false
    })
    .sink { _ in }
If not triggered, both methods are non-intrusive to the stream. Otherwise, they raise SIGTRAP signal, which gives an attached debugger the chance to interrupt the process at a specific point in its execution.
If no debugger is attached, the process is terminated and a crash report is generated.
Drawing Diagrams
If none of the above helps, you might verify your understanding of the publishers graph by drawing it by hand. The below code prints user infos by their full name and age:
let firstNames = PassthroughSubject<String, Never>()
let lastNames = PassthroughSubject<String, Never>()
let ageInYears = PassthroughSubject<Int, Never>()

let abbreviated = Publishers.CombineLatest(firstNames, lastNames)
    .map { "\($1) \($0.prefix(1))." }

let shortInfos = Publishers.CombineLatest(abbreviated, ageInYears)
    .map { "\($0), \($1) y.o." }
    .sink { print($0) }

firstNames.send("Vadim")
lastNames.send("Bulavin")
ageInYears.send(26)

// Prints 'Bulavin V., 26 y.o.'
Let’s see how we can turn this code into a diagram. The rectangles show publishers and the arrows display the relationships between them:

Marble Diagrams
Marble diagram shows behavior of one or more reactive stream in time sequence. It is widely adopted in Rx community and can be applied to the Swift Combine framework, since they both implement the same abstraction. It requires mapping between the concepts of ReactiveX and Combine, most of which are intuitive.
There is a cheat sheet to help you mirror Rx and Combine concepts.
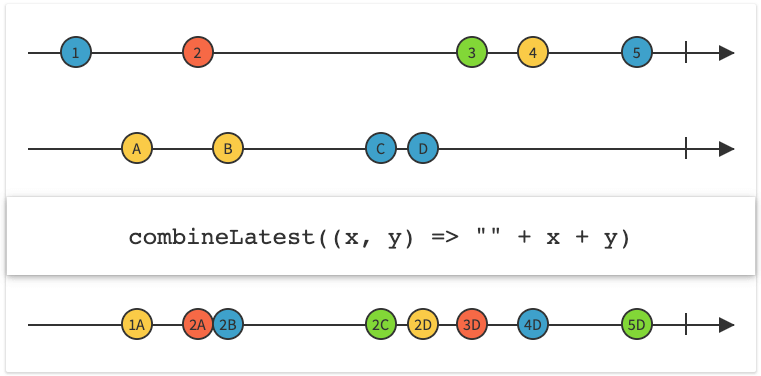
The below figure depicts the ReactiveX CombineLatest operator that exactly matches Publishers.CombineLatest, which we’ve used in the previous section:
Further Reading
If you want to learn more about the Swift Combine framework, I have some articles to suggest:
Thanks for reading!
If you enjoyed this post, be sure to follow me on Twitter to keep up with the new content. There I write daily on iOS development, programming, and Swift.